
Page 207 - Start Up Mathematics_5
P. 207
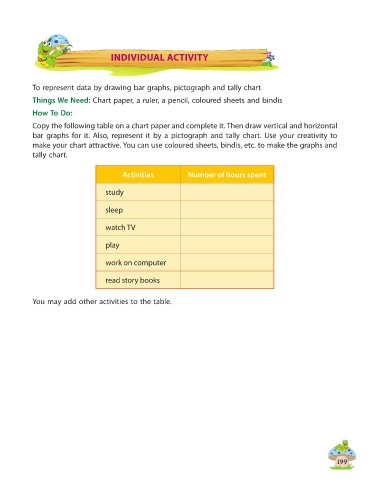
INDIVIDUAL ACTIVITY


            To represent data by drawing bar graphs, pictograph and tally chart

            Things We Need: Chart paper, a ruler, a pencil, coloured sheets and bindis
            How To Do:

            Copy the following table on a chart paper and complete it. Then draw vertical and horizontal
            bar  graphs  for  it.  Also,  represent  it  by  a  pictograph  and  tally  chart.  Use  your  creativity  to
            make your chart attractive. You can use coloured sheets, bindis, etc. to make the graphs and
            tally chart.


                                          Activities           Number of hours spent


                                    study

                                    sleep


                                    watch TV


                                    play

                                    work on computer


                                    read story books


            You may add other activities to the table.


                                                                                                                 199