
Page 201 - Start Up Mathematics_5
P. 201
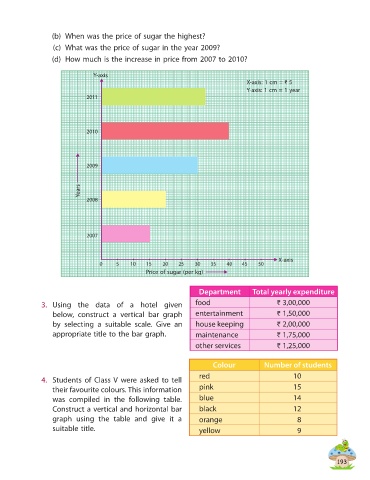
(b)  When was the price of sugar the highest?

                   (c)  What was the price of sugar in the year 2009?
                  (d)  How much is the increase in price from 2007 to 2010?


                                Y-axis
                                                                                   X-axis: 1 cm = ` 5
                                                                                   Y-axis: 1 cm = 1 year
                              2011


                              2010


                              2009


                           Years
                              2008


                              2007


                                                                                             X-axis
                                  0    5    10   15    20   25   30    35   40   45   50
                                                 Price of sugar (per kg)


                                                                   Department        Total yearly expenditure

              3.  Using the data of a hotel given                 food                       ` 3,00,000
                  below, construct a vertical bar graph           entertainment              ` 1,50,000
                  by selecting a suitable scale. Give an          house keeping              ` 2,00,000
                  appropriate title to the bar graph.             maintenance                ` 1,75,000
                                                                  other services             ` 1,25,000


                                                                       Colour           Number of students
                                                                   red                            10
              4.  Students of Class V were asked to tell
                  their favourite colours. This information        pink                           15
                  was compiled in the following table.             blue                           14
                  Construct a vertical and horizontal bar          black                          12
                  graph using the table and give it a              orange                          8
                  suitable title.                                  yellow                          9


                                                                                                                 193