
Page 199 - Start Up Mathematics_4
P. 199
EXERCISE 14.2
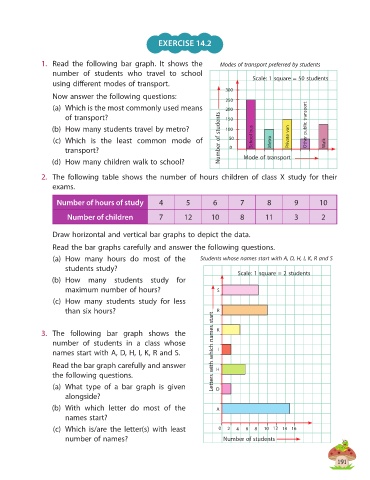
1. Read the following bar graph. It shows the Modes of transport preferred by students
number of students who travel to school
using different modes of transport. Scale: 1 square = 50 students
300
Now answer the following questions:
250
(a) Which is the most commonly used means 200
of transport? 150
(b) How many students travel by metro? 100 Other public transport
100
(c) Which is the least common mode of Number of students 50 School bus Metro Private van Walk
transport? 0
(d) How many children walk to school? Mode of transport
2. The following table shows the number of hours children of class X study for their
exams.
Number of hours of study 4 5 6 7 8 9 10
Number of children 7 12 10 8 11 3 2
Draw horizontal and vertical bar graphs to depict the data.
Read the bar graphs carefully and answer the following questions.
(a) How many hours do most of the Students whose names start with A, D, H, I, K, R and S
students study?
Scale: 1 square = 2 students
(b) How many students study for
maximum number of hours? S
(c) How many students study for less
than six hours? R
3. The following bar graph shows the K
number of students in a class whose
names start with A, D, H, I, K, R and S. Letters with which names start I
Read the bar graph care fully and answer H
the following questions.
(a) What type of a bar graph is given D
alongside?
(b) With which letter do most of the A
names start?
(c) Which is/are the letter(s) with least 0 2 4 6 8 10 12 14 16
number of names? Number of students
191