
Page 198 - Start Up Mathematics_4
P. 198
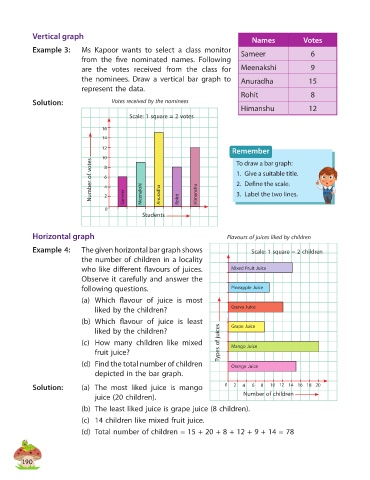
Vertical graph
                                                                                    Names            Votes
            Example 3:      Ms Kapoor wants to select a class monitor            Sameer                 6
                            from the five nominated names. Following
                            are  the  votes received  from  the  class  for      Meenakshi              9
                            the nominees. Draw a vertical bar graph to           Anuradha              15
                            represent the data.
                                                                                 Rohit                  8
            Solution:                 Votes received by the nominees
                                                                                 Himanshu              12
                                            Scale: 1 square = 2 votes

                                   16
                                   14
                                   12                                         Remember
                                   10 8                                        To draw a bar graph:
                               Number of votes  6 4  Meenakshi                 1.  Give a suitable title.


                                                                               2.  Define the scale.
                                                                               3.  Label the two lines.
                                    2
                                    0     Sameer      Anuradha  Rohit  Himanshu
                                                Students


            Horizontal graph                                                Flavours of juices liked by children
            Example 4:      The given horizontal bar graph shows                    Scale: 1 square = 2 children
                            the number of children in a locality
                            who like different flavours of juices.            Mixed Fruit Juice
                            Observe it carefully and answer the
                            following questions.                              Pineapple Juice

                            (a)   Which flavour of juice is most
                                liked by the children?                        Guava Juice
                            (b)   Which flavour of juice is least
                                liked by the children?                        Grape Juice

                            (c)   How many children like mixed            Types of juices  Mango Juice
                                fruit juice?
                            (d)   Find the total number of children           Orange Juice
                                depicted in the bar graph.

            Solution:       (a)   The most liked juice is mango            0  2  4  6  8  10 12 14 16 18 20
                                juice (20 children).                              Number of children
                            (b)   The least liked juice is grape juice (8 children).

                            (c)  14 children like mixed fruit juice.
                            (d)  Total number of children = 15 + 20 + 8 + 12 + 9 + 14 = 78


         190