
Page 194 - Start Up Mathematics_4
P. 194
14
Data Handling
Let’s Recall ...
• Pictograph is the method of representing data using pictures.
• Data can also be represented by using tally marks which are vertical lines
drawn for each observation. For the fifth observation, a line is drawn
crossing the four vertical lines | | | | .
Read the data about the favourite books of children in a class and represent it using
(a) pictograph and (b) tally marks. Then answer the questions that follow.
Type of books Children (i) How many children are there in all?
Adventure 10 (ii) Which type of book is most popular?
Horror 5 (iii) How many children like adventure and scientific
Comics 12 books?
Fairy tales 3 (iv) How many children do not like comics?
Scientific 4 (v) How many children like horror, comics and fairy tales?
Others 8
Pictographs and Tally Marks
We know that each picture in a pictograph represents a number. Now we will learn how
to interpret a data with two given scales and also to create a vertical pictograph using the
given information.
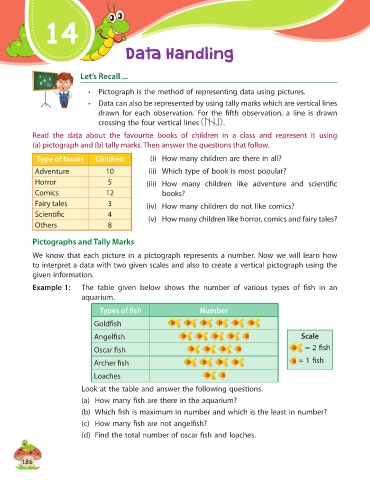
Example 1: The table given below shows the number of various types of fish in an
aquarium.
Types of fish Number
Goldfish
Angelfish Scale
Oscar fish = 2 fish
Archer fish = 1 fish
Loaches
Look at the table and answer the following questions.
(a) How many fish are there in the aquarium?
(b) Which fish is maximum in number and which is the least in number?
(c) How many fish are not angelfish?
(d) Find the total number of oscar fish and loaches.
186