Page 197 - Start Up Mathematics_4
P. 197

Now answer the following questions.

                  (a)  Which flavour of ice cream should he buy the most?
                  (b)  How many of Raghav’s classmates like mango ice cream?

                   (c)  Which is the least liked flavour among his classmates?
                  (d)  Which is the second most liked flavour among Raghav’s classmates?

              3.  Represent the given information using tally marks and vertical pictographs. Select your
                  own pictures and scales.

                  (a)  Favourite after-school activities of children of a class
                       Talk on phone: 4 children                     Play computer games: 6 children
                       Visit friends: 2 children                     Play sport: 10 children

                       Read books: 8 children                        Watch TV: 12 children

                  (b)  Favourite sweet dish of children of a class
                       Cake: 9                          Pudding: 8                 Rasgulla: 5
                       Ice cream: 10                    Kheer: 7                   Halwa: 6


            Bar Graphs

            Bar graph is another way of representing given data.              Remember

            A bar graph is made by drawing bars on paper having                Bars are drawn by keeping
            many small squares of equal size.                                  equal space between them.
            A bar graph consists of a vertical line and a horizontal line
            meeting at a point marked 0 (zero).

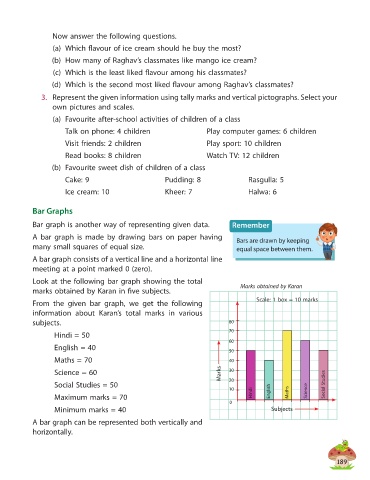
            Look at the following bar graph showing the total                    Marks obtained by Karan
            marks obtained by Karan in five subjects.

            From  the  given  bar  graph,  we  get  the  following                    Scale: 1 box = 10 marks
            information  about  Karan’s  total  marks  in  various
            subjects.                                                        80
                                                                             70
                   Hindi = 50
                                                                             60
                   English = 40                                              50
                   Maths = 70                                                40

                   Science = 60                                           Marks  30
                   Social Studies = 50                                       20                             Social Studies
                                                                             10           English      Science
                   Maximum marks = 70                                               Hindi       Maths
                                                                             0
                   Minimum marks = 40                                                      Subjects
            A bar graph can be represented both vertically and
            horizontally.


                                                                                                                 189
   192   193   194   195   196   197   198   199   200   201   202