
Page 200 - Start Up Mathematics_4
P. 200
(d) How many names start with H?
(e) How many students are there in the class?
LET’S EVALUATE
1. Following is the choice of eatables of 35 students of class IV. Represent the data using
a vertical pictograph and tally marks.
Eatables Number of students
Sandwiches 4
Pasta 10
Pizza 12
Noodles 9 Shells collected by five friends
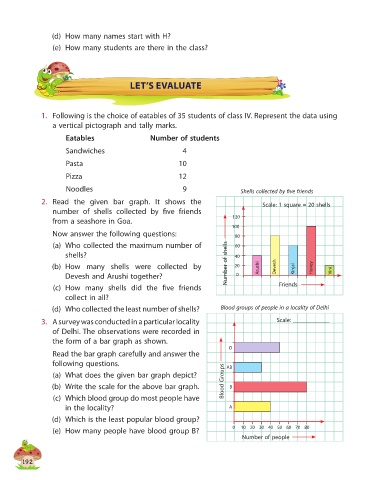
2. Read the given bar graph. It shows the Scale: 1 square = 20 shells
number of shells collected by five friends
from a seashore in Goa. 120
100
Now answer the following questions: 80
(a) Who collected the maximum number of 60
shells? 40
(b) How many shells were collected by Number of shells 20 Arushi Devesh Kinjal Honey Vini
Devesh and Arushi together? 0
(c) How many shells did the five friends Friends
collect in all?
(d) Who collected the least number of shells? Blood groups of people in a locality of Delhi
3. A survey was conducted in a particular locality Scale: ____________
of Delhi. The observations were recorded in
the form of a bar graph as shown.
O
Read the bar graph carefully and answer the
following questions. AB
(a) What does the given bar graph depict?
(b) Write the scale for the above bar graph. Blood Groups B
(c) Which blood group do most people have
in the locality? A
(d) Which is the least popular blood group?
(e) How many people have blood group B? 0 10 20 30 40 50 60 70 80
Number of people
192