
Page 202 - Start Up Mathematics_4
P. 202
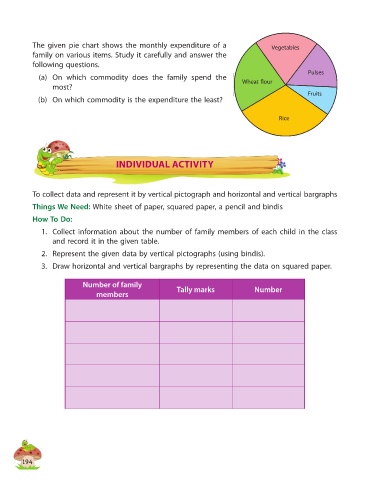
The given pie chart shows the monthly expenditure of a                         Vegetables
            family on various items. Study it carefully and answer the
            following questions.
                                                                                                       Pulses
              (a)  On which commodity does the family spend the                  Wheat flour
                  most?
                                                                                                       Fruits
              (b)  On which commodity is the expenditure the least?


                                                                                             Rice


                                       INDIVIDUAL ACTIVITY


            To collect data and represent it by vertical pictograph and horizontal and vertical bargraphs

            Things We Need: White sheet of paper, squared paper, a pencil and bindis
            How To Do:

              1.  Collect information about the number of family members of each child in the class
                  and record it in the given table.
              2.  Represent the given data by vertical pictographs (using bindis).

              3.  Draw horizontal and vertical bargraphs by representing the data on squared paper.


                            Number of family                Tally marks              Number
                                 members


         194