
Page 181 - ICSE Math 4
P. 181
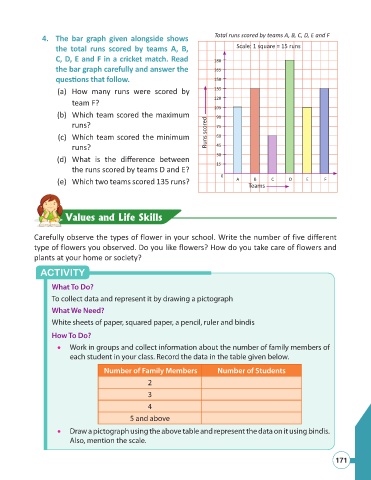
4. The bar graph given alongside shows Total runs scored by teams A, B, C, D, E and F
the total runs scored by teams A, B, Scale: 1 square = 15 runs
C, D, E and F in a cricket match. Read 180
the bar graph carefully and answer the 165
ques ons that follow. 150
(a) How many runs were scored by 135
120
team F?
105
(b) Which team scored the maximum 90
runs? 75
(c) Which team scored the minimum Runs scored 60
runs? 45
30
(d) What is the diff erence between
15
the runs scored by teams D and E?
0
(e) Which two teams scored 135 runs? A B C D E F
Teams
Values and Life Skills
Carefully observe the types of flower in your school. Write the number of five diff erent
type of flowers you observed. Do you like flowers? How do you take care of flowers and
plants at your home or society?
ACTIVITY
What To Do?
To collect data and represent it by drawing a pictograph
What We Need?
White sheets of paper, squared paper, a pencil, ruler and bindis
How To Do?
Work in groups and collect information about the number of family members of
each student in your class. Record the data in the table given below.
Number of Family Members Number of Students
2
3
4
5 and above
Draw a pictograph using the above table and represent the data on it using bindis.
Also, mention the scale.
171