Page 180 - ICSE Math 4
P. 180

Review Exercise


                      1.  The table given alongside shows the number
                           of fruits children had in a week. Represent the               Fruit      Number of Fruits
                           data in a pictograph and answer the ques  ons             Apple                  40
                           that follow.                                              Pear                   25
                           (a)  What is the total number of fruits depicted  Mango                          55
                                in the given data?                                   Banana                 45

                           (b)  Which is the most liked fruit?                       Strawberry             30
                            (c)  Which is the least liked fruit?
                           (d)  Which is the second most liked fruit?
                           (e)  Which is the second least liked fruit?


                     2.  The  informa  on given alongside shows the                                  Number of
                           number of chocolates sold in 5 weeks. Draw a              Week            Chocolates
                           pictograph using the informa  on and answer
                           the ques  ons that follow.                                   I               2,500
                                                                                        II              1,500
                           (a)  How many chocolates were sold in the
                                fi rst week?                                             III             3,500
                           (b)  How many chocolates were sold in all the               IV               2,000
                                fi ve weeks?                                             V               4,000

                            (c)  In which week were the maximum number of chocolates sold?
                           (d)  In which week were the least number of chocolates sold?
                           (e)  What is the diff erence in the number of chocolates sold in the fi rst week and the
                                fi   h week?

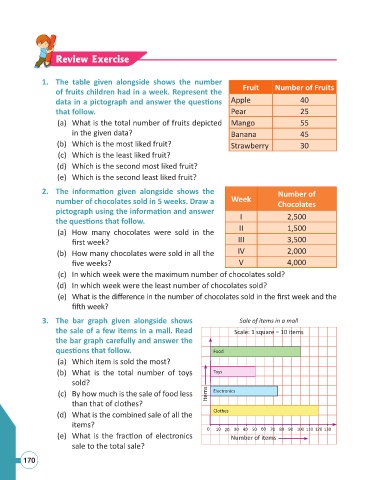
                      3.  The bar graph given alongside shows                           Sale of items in a mall
                           the sale of a few items in a mall. Read                    Scale: 1 square = 10 items
                           the bar graph carefully and answer the
                           ques  ons that follow.                              Food

                           (a)  Which item is sold the most?
                           (b)  What is the total number of toys               Toys
                                sold?

                            (c)  By how much is the sale of food less        Items  Electronics
                                than that of clothes?
                           (d)  What is the combined sale of all the           Clothes
                                items?
                                                                             0  10 20 30 40 50 60 70 80 90 100 110 120 130
                           (e)  What is the frac  on of electronics                  Number of items
                                sale to the total sale?

                170
   175   176   177   178   179   180   181   182   183   184   185