
Page 177 - ICSE Math 4
P. 177
(d) What is the total number of friends who like Grapes and Apples?
(e) What is the total number of friends whom Annie and Maria ask about their
favourite fruits?
3. The table given alongside shows the number of
Florists Number of Flowers
flowers sold by fi ve florists in two months.
A 2,300
Using the given informa on, draw a pictograph
and answer the following ques ons. B 1,900
(a) How many flowers did the florists sell in all? C 3,400
(b) How many more flowers did florist D sell D 2,900
than florist B?
E 3,700
(c) Who sold the minimum and the maximum
number of flowers?
(d) What is the total number of fl owers sold by florist E and florist C?
(e) How many more flowers need to be sold to have a total of 20,000 flowers?
Bar Graphs
A bar graph is another way of represen ng the collected data by drawing bars of diff erent
heights. It consists of a ver cal line and a horizontal line that meet at a certain point
marked 0 (zero). We usually draw a bar graph by selec ng an appropriate scale. Bars are
drawn by keeping equal space between them.
Just like a pictograph, a bar graph helps us to compare the given data or informa on. It
can be represented both horizontally and ver cally.
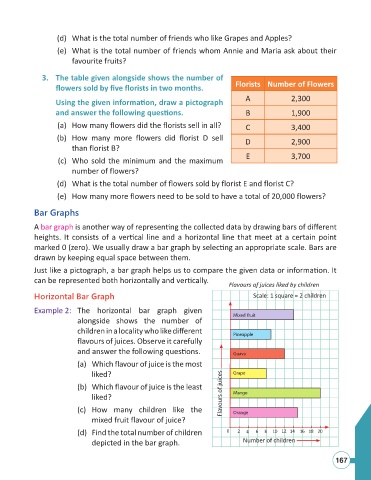
Flavours of juices liked by children
Horizontal Bar Graph Scale: 1 square = 2 children
Example 2: The horizontal bar graph given
Mixed fruit
alongside shows the number of
children in a locality who like diff erent
Pineapple
flavours of juices. Observe it carefully
and answer the following ques ons. Guava
(a) Which flavour of juice is the most
liked? Grape
(b) Which flavour of juice is the least
liked? Flavours of juices Mango
(c) How many children like the Orange
mixed fruit flavour of juice?
(d) Find the total number of children 0 2 4 6 8 10 12 14 16 18 20
depicted in the bar graph. Number of children
167