
Page 174 - ICSE Math 4
P. 174
Data Handlingta Handling
13 Da
Learning Outcomes
Students will be able to learn:
pictorial representation of raw data.
interpretation of bar graph.
We already know that data is a collec on of informa on or facts. Data handling is the
systema c way of arranging the collected data. However, this collected data is not in any
par cular order and is called raw data. Thus, it needs to be arranged in some order so that
we can obtain a result from it. There are various ways through which the raw data can be
arranged and represented in an organized manner. It can be represented in the form of
pictographs and bar graphs. Let’s study these ways of represen ng data.
Remember
Pictograph
A pictograph must
We have already learnt that a pictograph is the always have a title
representa on of data in the form of pictures or and a key to explain
what each picture or
symbols. Each picture or symbol in the pictograph
symbol stands for.
represents a number.
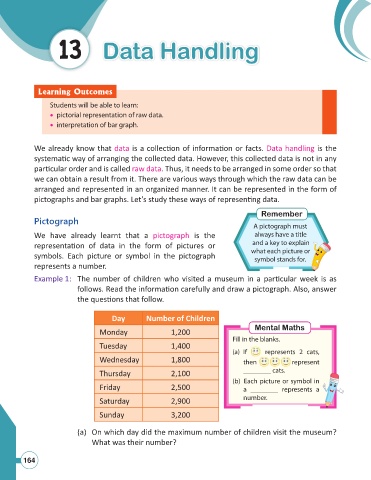
Example 1: The number of children who visited a museum in a par cular week is as
follows. Read the informa on carefully and draw a pictograph. Also, answer
the ques ons that follow.
Day Number of Children
Mental Maths
Monday 1,200
Fill in the blanks.
Tuesday 1,400
(a) If represents 2 cats,
Wednesday 1,800 then represent
Thursday 2,100 ________ cats.
(b) Each picture or symbol in
Friday 2,500 a ________ represents a
Saturday 2,900 number.
Sunday 3,200
(a) On which day did the maximum number of children visit the museum?
What was their number?
164