
Page 260 - ICSE Math 7
P. 260
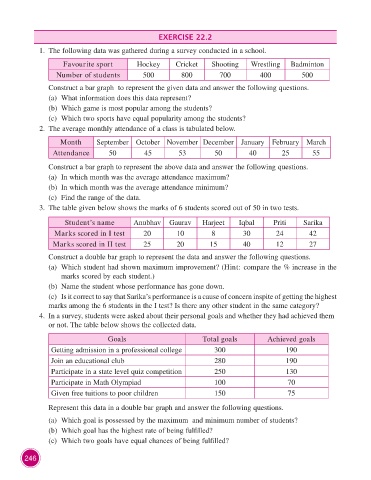
EXERCISE 22.2

                      1.  The following data was gathered during a survey conducted in a school.

                             Favourite sport          Hockey       Cricket     Shooting     Wrestling    Badminton
                           Number of students           500          800         700           400           500

                         Construct a bar graph  to represent the given data and answer the following questions.
                         (a)  What information does this data represent?
                         (b)  Which game is most popular among the students?
                         (c)  Which two sports have equal popularity among the students?
                      2.  The average monthly attendance of a class is tabulated below.

                            Month       September October November December January                February March
                          Attendance         50         45          53          50         40         25        55

                         Construct a bar graph to represent the above data and answer the following questions.
                         (a)  In which month was the average attendance maximum?
                         (b)  In which month was the average attendance minimum?
                         (c)  Find the range of the data.

                      3.  The table given below shows the marks of 6 students scored out of 50 in two tests.

                              Student’s name         Anubhav     Gaurav     Harjeet     Iqbal      Priti     Sarika
                          Marks scored in I test        20         10          8         30         24         42
                          Marks scored in II test       25         20         15         40         12         27

                         Construct a double bar graph to represent the data and answer the following questions.
                         (a)   Which student had shown maximum improvement? (Hint: compare the % increase in the
                             marks scored by each student.)
                         (b)  Name the student whose performance has gone down.
                         (c)  Is it correct to say that Sarika’s performance is a cause of concern inspite of getting the highest
                        marks among the 6 students in the I test? Is there any other student in the same category?
                      4.  In a survey, students were asked about their personal goals and whether they had achieved them
                        or not. The table below shows the collected data.

                                            Goals                           Total goals          Achieved goals
                         Getting admission in a professional college            300                    190
                         Join an educational club                               280                    190

                         Participate in a state level quiz competition          250                    130
                         Participate in Math Olympiad                           100                     70
                         Given free tuitions to poor children                   150                     75

                         Represent this data in a double bar graph and answer the following questions.

                         (a)  Which goal is possessed by the maximum  and minimum number of students?
                         (b)  Which goal has the highest rate of being fulfilled?
                         (c)  Which two goals have equal chances of being fulfilled?


                246