Page 263 - ICSE Math 7
P. 263

5.  List the natural numbers whose measure of central tendencies is as under:

                         mean = median = mode = 4. Is the answer unique?
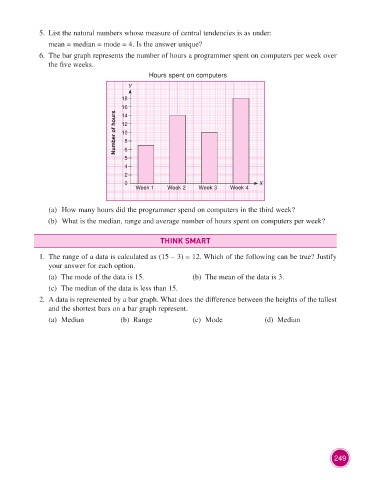
                      6.  The bar graph represents the number of hours a programmer spent on computers per week over
                        the five weeks.
                                                          Hours spent on computers

                                                   Y
                                                 18
                                                 16
                                               Number of hours  12
                                                 14
                                                 10
                                                  8
                                                  6
                                                  5
                                                  4
                                                  2
                                                  0                                            X
                                                     Week 1     Week 2    Week 3     Week 4


                         (a)  How many hours did the programmer spend on computers in the third week?
                         (b)  What is the median, range and average number of hours spent on computers per week?


                                                              THINK SMART

                      1.  The range of a data is calculated as (15 – 3) = 12. Which of the following can be true? Justify
                        your answer for each option.
                         (a)  The mode of the data is 15.               (b)  The mean of the data is 3.
                         (c)  The median of the data is less than 15.

                      2.  A data is represented by a bar graph. What does the difference between the heights of the tallest
                        and the shortest bars on a bar graph represent.
                         (a)  Median            (b)  Range              (c)  Mode               (d)  Median


                                                                                                                        249
   258   259   260   261   262   263   264   265   266   267   268