
Page 258 - ICSE Math 7
P. 258
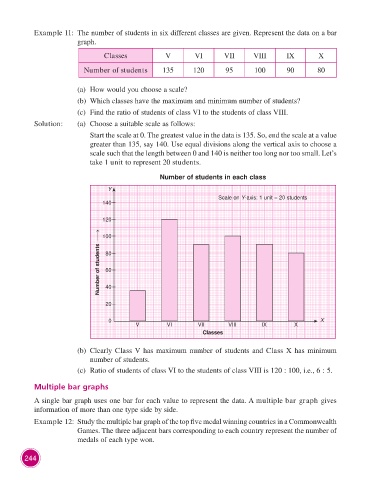
Example 11: The number of students in six different classes are given. Represent the data on a bar
graph.
Classes V VI VII VIII IX X
Number of students 135 120 95 100 90 80
(a) How would you choose a scale?
(b) Which classes have the maximum and minimum number of students?
(c) Find the ratio of students of class VI to the students of class VIII.
Solution: (a) Choose a suitable scale as follows:
Start the scale at 0. The greatest value in the data is 135. So, end the scale at a value
greater than 135, say 140. Use equal divisions along the vertical axis to choose a
scale such that the length between 0 and 140 is neither too long nor too small. Let’s
take 1 unit to represent 20 students.
Number of students in each class
Y
Scale on Y-axis: 1 unit = 20 students
140
120
Number of students → 80
100
60
40
20
0 X
V VI VII VIII IX X
Classes
(b) Clearly Class V has maximum number of students and Class X has minimum
number of students.
(c) Ratio of students of class VI to the students of class VIII is 120 : 100, i.e., 6 : 5.
Multiple bar graphs
A single bar graph uses one bar for each value to represent the data. A multiple bar graph gives
information of more than one type side by side.
Example 12: Study the multiple bar graph of the top five medal winning countries in a Commonwealth
Games. The three adjacent bars corresponding to each country represent the number of
medals of each type won.
244