
Page 255 - ICSE Math 7
P. 255
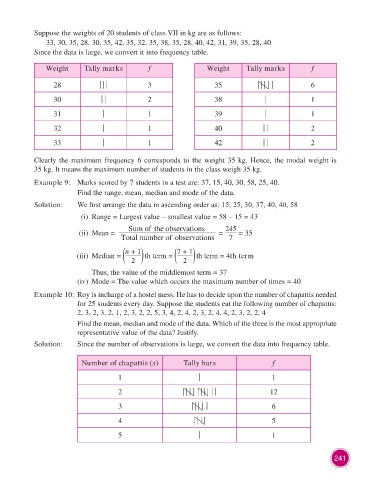
Suppose the weights of 20 students of class VII in kg are as follows:
                        33, 30, 35, 28, 30, 35, 42, 35, 32, 35, 38, 35, 28, 40, 42, 31, 39, 35, 28, 40
                    Since the data is large, we convert it into frequency table.


                        Weight      Tally marks           f                  Weight       Tally marks           f

                          28                             3                      35                              6

                          30                             2                      38                              1

                          31                             1                      39                              1

                          32                             1                      40                              2

                          33                             1                      42                              2


                    Clearly the maximum frequency 6 corresponds to the weight 35 kg. Hence, the modal weight is
                    35 kg. It means the maximum number of students in the class weigh 35 kg.
                    Example 9:  Marks scored by 7 students in a test are: 37, 15, 40, 30, 58, 25, 40.

                                  Find the range, mean, median and mode of the data.
                    Solution:     We first arrange the data in ascending order as: 15, 25, 30, 37, 40, 40, 58
                                   (i)  Range = Largest value – smallest value = 58 – 15 = 43

                                                   Sum of the observations         245
                                   (ii)  Mean =                                  =      = 35
                                                 Tota   umber of observations        7

                                                  n + 1            7 + 1
                                  (iii)  Median =       th term =         th term = 4th term
                                                    2                2
                                        Thus, the value of the middlemost term = 37
                                  (iv)  Mode = The value which occurs the maximum number of times = 40

                    Example 10: Roy is incharge of a hostel mess. He has to decide upon the number of chapattis needed
                                  for 25 students every day. Suppose the students eat the following number of chapattis:
                                  2, 3, 2, 3, 2, 1, 2, 3, 2, 2, 5, 3, 4, 2, 4, 2, 3, 2, 4, 4, 2, 3, 2, 2, 4

                                  Find the mean, median and mode of the data. Which of the three is the most appropriate
                                  representative value of the data? Justify.

                    Solution:     Since the number of observations is large, we convert the data into frequency table.


                                   Number of chapattis (x)           Tally bars                    f

                                                1                                                  1

                                                2                                                 12

                                                3                                                  6

                                                4                                                  5

                                                5                                                  1


                                                                                                                        241