
Page 251 - ICSE Math 7
P. 251
The data in this form is called raw or ungrouped data. In this form the data is not easy to understand
and interpret. The data becomes meaningful if we arrange it in ascending or descending order of
magnitude called an array. The above data arranged in ascending order is:
4, 5, 7, 10, 13, 17, 23, 30, 41, 42, 55, 69, 74, 86, 90, 93, 98, 102, 110, 115, 118
In this form, we can analyze the data very fast and know that the highest runs scored is 118 and the
minimum runs scored is 4. Not only this, there are a total of 4 centuries scored and 10 players failed
to reach the half century mark.
The spread in the data called its range is the difference between the highest and the lowest scores.
With the data in ascending order, we can immediately determine its range as follows:
Range = Highest Value – Lowest Value = 118 – 4 = 114 runs
Now, if we arrange the above data in the form of frequency distribution using tally marks, it becomes
capable of being analyzed further.
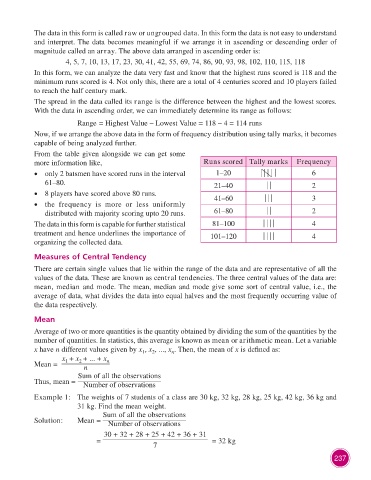
From the table given alongside we can get some
more information like, Runs scored Tally marks Frequency
• only 2 batsmen have scored runs in the interval 1–20 6
61–80. 21–40 2
• 8 players have scored above 80 runs. 41–60 3
• the frequency is more or less uniformly
distributed with majority scoring upto 20 runs. 61–80 2
The data in this form is capable for further statistical 81–100 4
treatment and hence underlines the importance of 101–120 4
organizing the collected data.
Measures of Central Tendency
There are certain single values that lie within the range of the data and are representative of all the
values of the data. These are known as central tendencies. The three central values of the data are:
mean, median and mode. The mean, median and mode give some sort of central value, i.e., the
average of data, what divides the data into equal halves and the most frequently occurring value of
the data respectively.
Mean
Average of two or more quantities is the quantity obtained by dividing the sum of the quantities by the
number of quantities. In statistics, this average is known as mean or arithmetic mean. Let a variable
x have n different values given by x , x , ..., x . Then, the mean of x is defined as:
2
n
1
x + x + ... + x
Mean = 1 2 n n
Sum of all the observations
Thus, mean = Number of observations
Example 1: The weights of 7 students of a class are 30 kg, 32 kg, 28 kg, 25 kg, 42 kg, 36 kg and
31 kg. Find the mean weight.
Sum of all the observations
Solution: Mean = Number of observations
30 + 32 + 28 + 25 + 42 + 36 + 31
= = 32 kg
7
237