
Page 50 - Viva ICSE Computer Studies 8 : E-book
P. 50
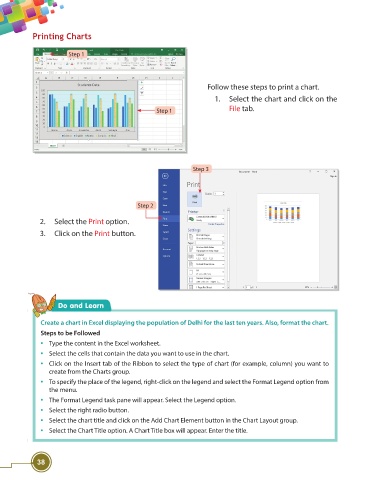
Printing Charts


                                Step 1


                                                                             Follow these steps to print a chart.

                                                                                1.  Select the chart and click on the
                                                                                     File tab.
                                                             Step 1


                                                                         Step 3


                                                      Step 2

                      2. Select the Print option.
                      3.  Click on the Print button.


                            Do and Learn


                      Create a chart in Excel displaying the population of Delhi for the last ten years. Also, format the chart.
                      Steps to be Followed
                      •  Type the content in the Excel worksheet.
                      •  Select the cells that contain the data you want to use in the chart.
                      •  Click on the Insert tab of the Ribbon to select the type of chart (for example, column) you want to
                         create from the Charts group.
                      •  To specify the place of the legend, right-click on the legend and select the Format Legend option from
                         the menu.
                      •  The Format Legend task pane will appear. Select the Legend option.
                      •  Select the right radio button.
                      •  Select the chart title and click on the Add Chart Element button in the Chart Layout group.
                      •  Select the Chart Title option. A Chart Title box will appear. Enter the title.


                     38