Page 295 - ICSE Math 8
P. 295

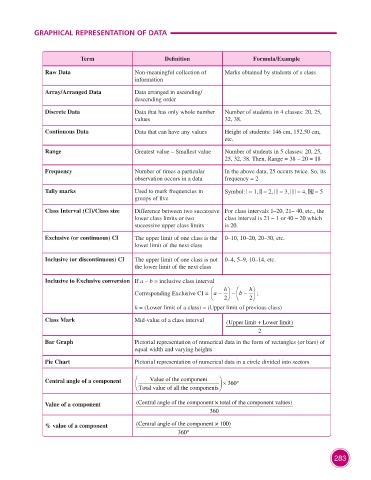
GRAPHICAL REPRESENTATION OF DATA


                                   Term                        Definition                    Formula/Example

                       Raw Data                      Non-meaningful collection of   Marks obtained by students of a class
                                                     information

                       Array/Arranged Data           Data arranged in ascending/
                                                     descending order

                       Discrete Data                 Data that has only whole number   Number of students in 4 classes: 20, 25,
                                                     values                        32, 38.

                       Continuous Data               Data that can have any values  Height of students: 146 cm, 152.50 cm,
                                                                                   etc.

                       Range                         Greatest value – Smallest value  Number of students in 5 classes: 20, 25,
                                                                                   25, 32, 38. Then, Range = 38 – 20 = 18
                       Frequency                     Number of times a particular   In the above data, 25 occurs twice. So, its
                                                     observation occurs in a data  frequency = 2
                       Tally marks                   Used to mark frequencies in   Symbol:  = 1,   = 2,   = 3,   = 4,   = 5
                                                     groups of five
                       Class Interval (CI)/Class size  Difference between two successive  For class intervals 1–20, 21– 40, etc., the
                                                     lower class limits or two     class interval is 21 – 1 or 40 – 20 which
                                                     successive upper class limits  is 20.

                       Exclusive (or continuous) CI  The upper limit of one class is the  0–10, 10–20, 20–30, etc.
                                                     lower limit of the next class

                       Inclusive (or discontinuous) CI  The upper limit of one class is not  0–4, 5–9, 10–14, etc.
                                                     the lower limit of the next class

                       Inclusive to Exclusive conversion If a – b = inclusive class interval
                                                     Corresponding Exclusive CI =  a −      h    −      b −  h    ;
                                                                                  2     2 
                                                     h = (Lower limit of a class) – (Upper limit of previous class)
                       Class Mark                    Mid-value of a class interval  (Upper limit + Lower limit)
                                                                                              2

                       Bar Graph                     Pictorial representation of numerical data in the form of rectangles (or bars) of
                                                     equal width and varying heights

                       Pie Chart                     Pictorial representation of numerical data in a circle divided into sectors


                       Central angle of a component      Value of the component  
                                                                                  ×  360°
                                                       Total value of all the components 

                       Value of a component           (Central angle of the component × total of the component values)
                                                                              360

                       % value of a component         (Central angle of the component × 100)
                                                                   360°


                                                                                                                        283
   290   291   292   293   294   295   296   297   298   299   300