
Page 294 - Start Up Mathematics_7
P. 294
(a) Which goal is possessed by maximum number of students?
(b) Which goal is possessed by the least number of students?
(c) Which goal has the highest rate of being fulfilled?
(d) Which two goals have equal chances of being fulfilled?
(e) Which goal can be termed as the modal goal?
Maths Lab Activity
Objective: To collect data, convert it into frequency distribution and find its central tendencies
Step 1: Collection of data Number
Collect the measure of weights of all the students of Weight of
your class. (in kg) students
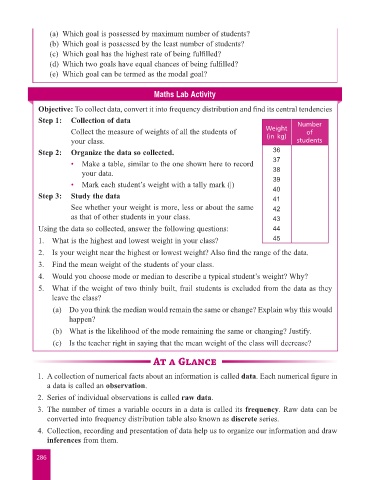
Step 2: Organize the data so collected. 36
• Make a table, similar to the one shown here to record 37
your data. 38
• Mark each student’s weight with a tally mark (|) 39
Step 3: Study the data 40
41
See whether your weight is more, less or about the same 42
as that of other students in your class. 43
Using the data so collected, answer the following questions: 44
1. What is the highest and lowest weight in your class? 45
2. Is your weight near the highest or lowest weight? Also find the range of the data.
3. Find the mean weight of the students of your class.
4. Would you choose mode or median to describe a typical student’s weight? Why?
5. What if the weight of two thinly built, frail students is excluded from the data as they
leave the class?
(a) Do you think the median would remain the same or change? Explain why this would
happen?
(b) What is the likelihood of the mode remaining the same or changing? Justify.
(c) Is the teacher right in saying that the mean weight of the class will decrease?
At a Glance
1. A collection of numerical facts about an information is called data. Each numerical figure in
a data is called an observation.
2. Series of individual observations is called raw data.
3. The number of times a variable occurs in a data is called its frequency. Raw data can be
converted into frequency distribution table also known as discrete series.
4. Collection, recording and presentation of data help us to organize our information and draw
inferences from them.
286