
Page 289 - Start Up Mathematics_7
P. 289
n + 1 7 + 1
(iii) Median = th term = th term = 4th term
2 2
Thus, the value of the middlemost term = T = 37
4
(iv) Mode = The value which occurs the maximum number of times = 40
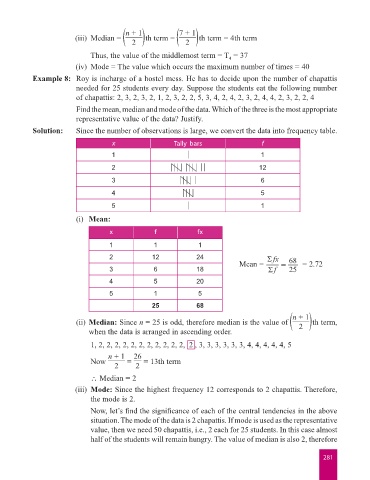
Example 8: Roy is incharge of a hostel mess. He has to decide upon the number of chapattis
needed for 25 students every day. Suppose the students eat the following number
of chapattis: 2, 3, 2, 3, 2, 1, 2, 3, 2, 2, 5, 3, 4, 2, 4, 2, 3, 2, 4, 4, 2, 3, 2, 2, 4
Find the mean, median and mode of the data. Which of the three is the most appropriate
representative value of the data? Justify.
Solution: Since the number of observations is large, we convert the data into frequency table.
x Tally bars f
1 1
2 12
3 6
4 5
5 1
(i) Mean:
x f fx
1 1 1
2 12 24 Σ fx 68
Mean = = = = 2.72
Σ
3 6 18 Σ f 25
4 5 20
5 1 5
25 68
n + 1
(ii) Median: Since n = 25 is odd, therefore median is the value of 2 th term,
when the data is arranged in ascending order.
1, 2, 2, 2, 2, 2, 2, 2, 2, 2, 2, 2, 2 , 3, 3, 3, 3, 3, 3, 4, 4, 4, 4, 4, 5
n + 1 26
Now = = 13th term
2 2
∴ Median = 2
(iii) Mode: Since the highest frequency 12 corresponds to 2 chapattis. Therefore,
the mode is 2.
Now, let’s find the significance of each of the central tendencies in the above
situation. The mode of the data is 2 chapattis. If mode is used as the representative
value, then we need 50 chapattis, i.e., 2 each for 25 students. In this case almost
half of the students will remain hungry. The value of median is also 2, therefore
281