
Page 292 - Start Up Mathematics_7
P. 292
Multiple bar graphs
A single bar graph uses one bar for each value to represent the data. A multiple bar graph gives
information of more than one type side by side.
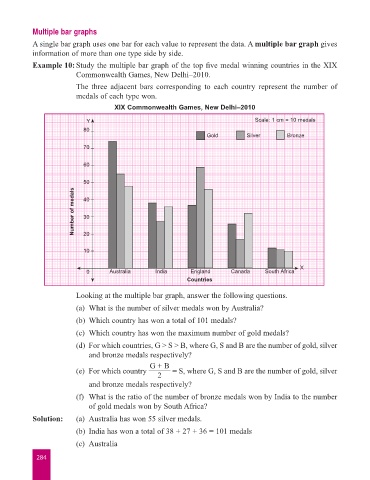
Example 10: Study the multiple bar graph of the top five medal winning countries in the XIX
Commonwealth Games, New Delhi–2010.
The three adjacent bars corresponding to each country represent the number of
medals of each type won.
XIX Commonwealth Games, New Delhi–2010
Y Scale: 1 cm = 10 medals
80
Gold Silver Bronze
70
60
50
Number of medals 40
30
20
10
X
0 Australia India England Canada South Africa
Countries
Looking at the multiple bar graph, answer the following questions.
(a) What is the number of silver medals won by Australia?
(b) Which country has won a total of 101 medals?
(c) Which country has won the maximum number of gold medals?
(d) For which countries, G > S > B, where G, S and B are the number of gold, silver
and bronze medals respectively?
G + B
(e) For which country = S, where G, S and B are the number of gold, silver
2
and bronze medals respectively?
(f) What is the ratio of the number of bronze medals won by India to the number
of gold medals won by South Africa?
Solution: (a) Australia has won 55 silver medals.
(b) India has won a total of 38 + 27 + 36 = 101 medals
(c) Australia
284