Page 371 - Start Up Mathematics_8 (Non CCE)
P. 371

OR
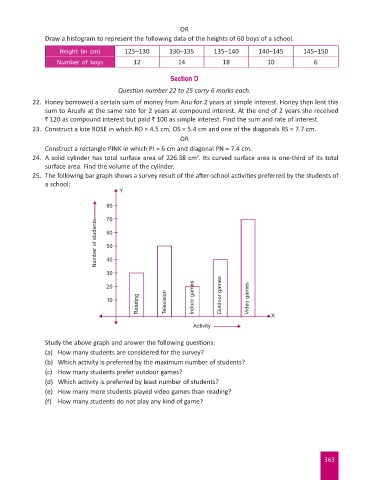
                         Draw a histogram to represent the following data of the heights of 60 boys of a school.

                             Height (in cm)       125–130        130–135        135–140       140–145        145–150
                            Number of boys           12             14             18            10             6

                                                                 Section D

                                                Question number 22 to 25 carry 6 marks each.
                     22.  Honey borrowed a certain sum of money from Anu for 2 years at simple interest. Honey then lent this
                        sum to Arushi at the same rate for 2 years at compound interest. At the end of 2 years she received
                        ` 120 as compound interest but paid ` 100 as simple interest. Find the sum and rate of interest.
                     23.  Construct a kite ROSE in which RO = 4.5 cm, OS = 5.4 cm and one of the diagonals RS = 7.7 cm.
                                                                     OR
                         Construct a rectangle PINK in which PI = 6 cm and diagonal PN = 7.4 cm.
                     24.  A solid cylinder has total surface area of 226.38 cm . Its curved surface area is one-third of its total
                                                                          2
                        surface area. Find the volume of the cylinder.
                     25.  The following bar graph shows a survey result of the after-school activities preferred by the students of
                        a school:
                                                 Y

                                            80
                                            70
                                         Number of students  60


                                            50

                                            40
                                            30

                                            20
                                                       Reading  Television
                                            10                           Indoor games  Outdoor games  Video games

                                                                                                  X
                                                                         Activity

                         Study the above graph and answer the following questions:
                         (a)  How many students are considered for the survey?
                         (b)  Which activity is preferred by the maximum number of students?
                         (c)  How many students prefer outdoor games?
                         (d)  Which activity is preferred by least number of students?
                         (e)  How many more students played video games than reading?
                         (f)  How many students do not play any kind of game?


                                                                                                                    363
   366   367   368   369   370   371   372   373   374   375   376