Page 368 - Start Up Mathematics_8 (Non CCE)
P. 368

Section C

                      3.  Fill in the blanks:                                                              1 M × 5 = 5 M
                         (a)  __________ of a simple closed figure is the sum of all the sides.
                         (b)  The length of the diagonal of a cube is __________ units.
                         (c)  There are two types of class intervals — __________ and __________.
                         (d)  A __________ is a pictorial representation of numerical data in a circle divided into sectors.
                         (e)  For any event P(A) + P(A) = __________.

                                                                 Section D

                      4.  Give one word or sentence for the following:                                     1 M × 5 = 5 M
                         (a)  Write the Heron’s formula for finding area of triangle.
                         (b)  Define volume.
                         (c)  Define discrete data.
                         (d)  What is a histogram?
                         (e)  Define a random experiment.

                                                                 Section E

                      5.  Find the area levelled by a cylindrical roller of diameter 60 cm and length 2.1 m in 150 revolutions.
                                                                                                                     2 M
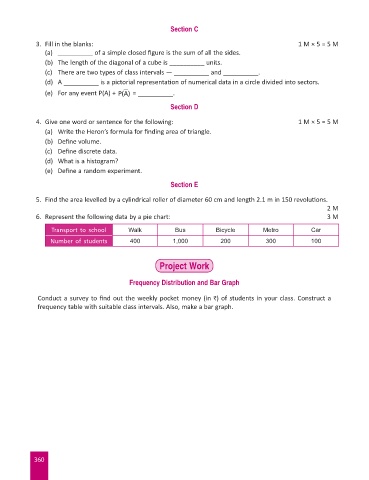
                      6.  Represent the following data by a pie chart:                                               3 M

                           Transport to school      Walk           Bus          Bicycle         Metro          Car
                          Number of students        400           1,000           200            300           100


                                                              Project Work


                                                    Frequency Distribution and Bar Graph

                      Conduct a survey to find out the weekly pocket money (in `) of students in your class. Construct a
                      frequency table with suitable class intervals. Also, make a bar graph.


                     360
   363   364   365   366   367   368   369   370   371   372   373