
Page 358 - Start Up Mathematics_8 (Non CCE)
P. 358
Technology Linking Mathematics with ICT
Section
1. Identify in your surroundings, objects of different geometric shapes like cube, cuboid, cylinder or hollow
cylinder. Either take their photographs and upload them on your computer or search and download the
photographs using the internet.
Now measure the dimensions of each object and calculate its surface area.
Make a PowerPoint presentation showing:
• the object
• the top and front view of the object
• dimensions
• surface area
2. Use the internet to collect data about the diameter of the planets in the solar system, their period of
revolution around the sun and distance from the sun. Estimate the data to the nearest whole number.
Now choosing appropriate scales on X-axis and Y-axis, make 3 bar graphs in MS Excel for each category.
Take printouts of your work and paste them in your project file.
You may access the following website:
http://www.enchantedlearning.com/subjects/astronomy/planets/
3. Suppose you have to organize your birthday or class party. In MS Excel, make a list of the things you
will need for the party under the headings—Eatables, Decorations and Disposable Things. Write the
approximate quantity and cost of all the things in your list to find the total expected expenditure. Now
assume you are getting a discount of 5% on eatables, 7% on decorations and 2% on disposable things.
Write the new total expenditure. Make pie charts of the original and discounted expenditure and compare
the two.
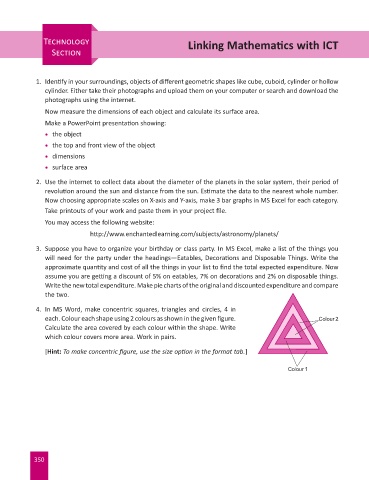
4. In MS Word, make concentric squares, triangles and circles, 4 in
each. Colour each shape using 2 colours as shown in the given figure. Colour 2
Calculate the area covered by each colour within the shape. Write
which colour covers more area. Work in pairs.
[Hint: To make concentric figure, use the size option in the format tab.]
Colour 1
350