
Page 303 - Start Up Mathematics_6
P. 303
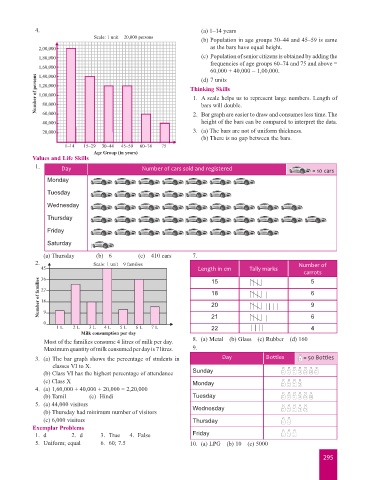
4. (a) 1–14 years
(b) Population in age groups 30–44 and 45–59 is same
as the bars have equal height.
(c) Population of senior citizens is obtained by adding the
frequencies of age groups 60–74 and 75 and above =
60,000 + 40,000 = 1,00,000.
(d) 7 units
Thinking Skills
1. A scale helps us to represent large numbers. Length of
bars will double.
2. Bar graph are easier to draw and consumes less time. The
height of the bars can be compared to interpret the data.
3. (a) The bars are not of uniform thickness.
(b) There is no gap between the bars.
Values and Life Skills
1. Day Number of cars sold and registered = 10 cars
Monday
Tuesday
Wednesday
Thursday
Friday
Saturday
(a) Thursday (b) 6 (c) 410 cars 7.
2. Scale: 1 unit = 9 families Number of
45 Length in cm Tally marks
carrots
36
15
5
Number of families 27 18 6
18
20
9
0 9 21 6
1 L 2 L 3 L 4 L 5 L 6 L 7 L 22 4
Milk consumption per day
Most of the families consume 4 litres of milk per day. 8. (a) Metal (b) Glass (c) Rubber (d) 160
Maximum quantity of milk consumed per day is 7 litres. 9.
3. (a) The bar graph shows the percentage of students in Day Bottles = 50 Bottles
classes VI to X.
(b) Class VI has the highest percentage of attendance Sunday
(c) Class X Monday
4. (a) 1,60,000 + 40,000 + 20,000 = 2,20,000
(b) Tamil (c) Hindi Tuesday
5. (a) 44,000 visitors
(b) Thursday had minimum number of visitors Wednesday
(c) 6,000 visitors Thursday
Exemplar Problems
1. d 2. d 3. True 4. False Friday
5. Uniform; equal 6. 60; 7.5 10. (a) LPG (b) 10 (c) 5000
295