
Page 302 - Start Up Mathematics_6
P. 302
2. Answer in One Word or a Line
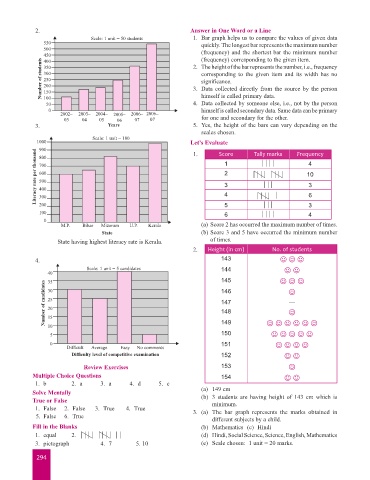
Scale: 1 unit = 50 students 1. Bar graph helps us to compare the values of given data
550 quickly. The longest bar represents the maximum number
500
(frequency) and the shortest bar the minimum number
450 2. The height of the bar represents the number, i.e., frequency
(frequency) corresponding to the given item.
Number of students 350 corresponding to the given item and its width has no
400
300
250
significance.
200 3. Data collected directly from the source by the person
150
100 himself is called primary data.
50 4. Data collected by someone else, i.e., not by the person
0 himself is called secondary data. Same data can be primary
2002– 2003– 2004– 2005– 2006– 2006–
03 04 05 06 07 07 for one and secondary for the other.
3. Years 5. Yes, the height of the bars can vary depending on the
scales chosen.
Scale: 1 unit = 100
1000 Let’s Evaluate Tally marks Frequency
900
Literacy rate per thousand 700 1 10
1.
Score
800
4
2
600
500
3
3
400
4
300
200
3
100 5 6
6
4
0
M.P. Bihar Mizoram U.P. Kerala (a) Score 2 has occurred the maximum number of times.
State (b) Score 3 and 5 have occurred the minimum number
State having highest literacy rate is Kerala. of times.
2. Height (in cm) No. of students
4. 143
Scale: 1 unit = 5 candidates 144
40 145
35
Number of candidates 30 146
25
—
147
20
148
15
10
150
5 149
0 151
Difficult Average Easy No comments
Difficulty level of competitive examination 152
Review Exercises 153
Multiple Choice Questions 154
1. b 2. a 3. a 4. d 5. c
Solve Mentally (a) 149 cm
True or False (b) 3 students are having height of 143 cm which is
minimum.
1. False 2. False 3. True 4. True 3. (a) The bar graph represents the marks obtained in
5. False 6. True different subjects by a child.
Fill in the Blanks (b) Mathematics (c) Hindi
1. equal 2. (d) Hindi, Social Science, Science, English, Mathematics
3. pictograph 4. 7 5. 10 (e) Scale chosen: 1 unit = 20 marks.
294