
Page 182 - Start Up Mathematics_3
P. 182
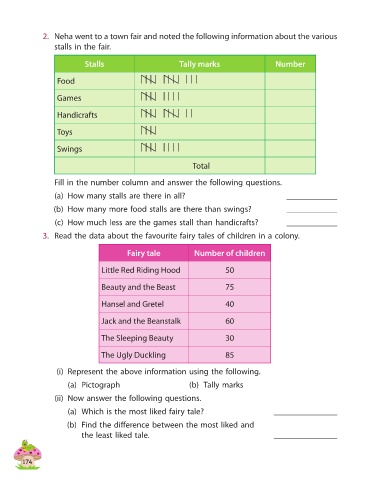
2.  Neha went to a town fair and noted the following information about the various
                   stalls in the fair.


                             Stalls                         Tally marks                     Number


                    Food                         | | | | | | | | | | |


                    Games                        | | | | | | | |


                    Handicrafts                  | | | | | | | | | |


                    Toys                         | | | |


                    Swings                       | | | | | | | |

                                                                 Total

                   Fill in the number column and answer the following questions.

                   (a)  How many stalls are there in all?                                       ____________

                   (b)  How many more food stalls are there than swings?                        ____________

                   (c)  How much less are the games stall than handicrafts?                     ____________

              3.  Read the data about the favourite fairy tales of children in a colony.

                                           Fairy tale            Number of children


                                   Little Red Riding Hood                   50

                                   Beauty and the Beast                     75


                                   Hansel and Gretel                        40

                                   Jack and the Beanstalk                   60


                                   The Sleeping Beauty                      30

                                   The Ugly Duckling                        85


                    (i)  Represent the above information using the following.
                       (a)  Pictograph                          (b)  Tally marks

                   (ii)  Now answer the following questions.

                       (a)  Which is the most liked fairy tale?                             _______________
                       (b)  Find the difference between the most liked and

                            the least liked tale.                                           _______________


         174