
Page 131 - ICSE Math 2
P. 131
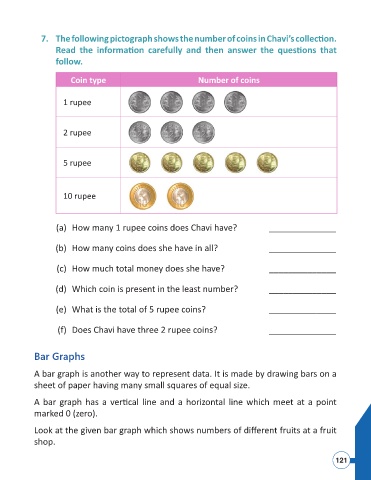
7.  The following pictograph shows the number of coins in Chavi’s collec  on.
                           Read the informa  on carefully and then answer the ques  ons  that
                           follow.


                                Coin type                                 Number of coins


                             1 rupee


                             2 rupee


                             5 rupee


                             10 rupee


                           (a)  How many 1 rupee coins does Chavi have?                           ______________


                           (b)  How many coins does she have in all?                              ______________


                           (c)  How much total money does she have?                               ______________


                           (d)  Which coin is present in the least number?                        ______________


                           (e)  What is the total of 5 rupee coins?                               ______________


                           (f)  Does Chavi have three 2 rupee coins?                              ______________


                    Bar Graphs


                    A bar graph is another way to represent data. It is made by drawing bars on a

                    sheet of paper having many small squares of equal size.

                    A bar graph has a ver  cal line and a horizontal line which meet at a point

                    marked 0 (zero).

                    Look at the given bar graph which shows numbers of diff erent fruits at a fruit
                    shop.


                                                                                                                        121