
Page 128 - ICSE Math 2
P. 128
Look at the arranged data and answer the following ques ons.
(a) Which day has the maximum number of birthdays? _____________
(b) Which day has the minimum number of birthdays? _____________
(c) Which day has the second highest number
of birthdays? _____________
(d) How many children are there in the class? _____________
(e) How many children have their birthdays on
Saturday or Sunday? _____________
Pictograph
We can arrange data in the form of pictures. The representa on of data in the
form of pictures is called a pictograph.
Look at the given example.
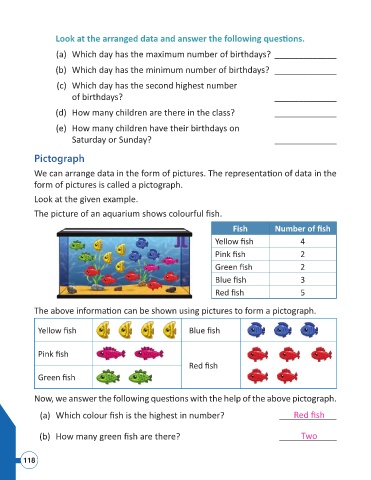
The picture of an aquarium shows colourful fi sh.
Fish Number of fi sh
Yellow fi sh 4
Pink fi sh 2
Green fi sh 2
Blue fi sh 3
Red fi sh 5
The above informa on can be shown using pictures to form a pictograph.
Yellow fi sh Blue fi sh
Pink fi sh
Red fi sh
Green fi sh
Now, we answer the following ques ons with the help of the above pictograph.
Red fi sh
(a) Which colour fi sh is the highest in number? ____________
Two
(b) How many green fi sh are there? ____________
118