
Page 393 - Start Up Mathematics_8 (Non CCE)
P. 393
(g) When the class-intervals are so arranged that the 5. (a) 20 (b) 60 (c) 4 (d) 20 – 30
upper limit of one class is the lower limit of the next (e) 30 – 40 (f) 10
class, it is called exclusive or continuous class-interval.
(h) When the class-intervals are so arranged that the upper Chapter 21
limit of one class is not the lower limit of the next class,
it is called inclusive or discontinuous class-interval. Exercise 21.1
Let’s Evaluate 2. (a) The number of persons is maximum in the group
65–70 (kg).
3. (a) 5 (b) 40 (c) 60 (d) 32.5 (e) 10 (b) 5
6. (b) 100 (c) 31 (d) 69 (e) 3 (c) The number of persons is minimum in the group
(f) 11 (g) 5 55–60 (kg).
Thinking Skills 3. (a) 20
(b) Maximum earning group is 60–80 (in `)
1. Concentration of Tally Number of days (c) Minimum earning group is 0–20 (in `) (d) 18
NO (in ppm) marks (frequency) 4. (a) This histogram depicts the ages of 4,050 literate
2
0.010 – 0.014 | | | | 4 females.
0.014 – 0.018 | | 7 (b) The number of literate females are maximum in the
0.018 – 0.022 | | | 8 age group 15–20 years.
0.022 – 0.026 | 6 (c) The number of literate females are minimum in the
age group 40–45 years.
0.026 – 0.030 5 (d) The width of each class interval is 5.
Total 30 (e) Class marks of 15–20 = 17.5
Class marks of 25–30 = 27.5
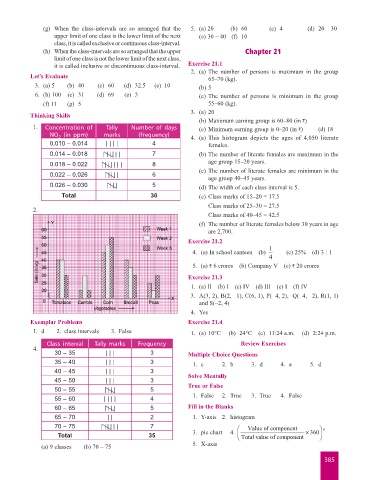
2.
Class marks of 40–45 = 42.5
(f) The number of literate females below 30 years in age
are 2,700.
Exercise 21.2
1
4. (a) In school canteen (b) (c) 25% (d) 3 : 1
4
5. (a) ` 6 crores (b) Company V (c) ` 20 crores
Exercise 21.3
1. (a) II (b) I (c) IV (d) III (e) I (f) IV
3. A(3, 2), B(2, –1), C(6, 1), P(–4, 2), Q(–4, –2), R(1, 1)
and S(–2, 4)
4. Yes
Exemplar Problems Exercise 21.4
1. d 2. class intervals 3. False 1. (a) 10°C (b) 24°C (c) 11:24 a.m. (d) 2:24 p.m.
Class interval Tally marks Frequency Review Exercises
4.
30 – 35 | | | 3 Multiple Choice Questions
35 – 40 | | | 3 1. c 2. b 3. d 4. a 5. d
40 – 45 | | | 3
45 – 50 | | | 3 Solve Mentally
50 – 55 5 True or False
55 – 60 | | | | 4 1. False 2. True 3. True 4. False
60 – 65 5 Fill in the Blanks
65 – 70 | | 2 1. Y-axis 2. histogram
70 – 75 | | 7 Ê Value of component ˆ
Total 35 3. pie chart 4. Á Ë Total value of component ¥ 360 ˜ ¯ ∞
(a) 9 classes (b) 70 – 75 5. X-axis
385