
Page 332 - Start Up Mathematics_7
P. 332
Passage 3
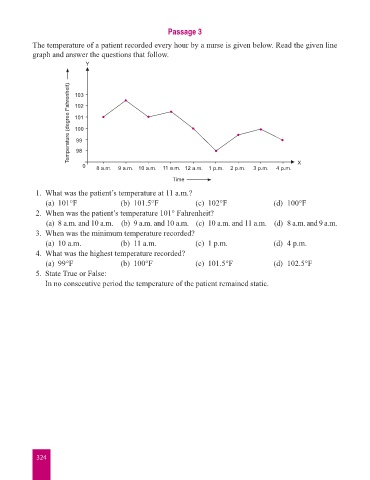
The temperature of a patient recorded every hour by a nurse is given below. Read the given line
graph and answer the questions that follow.
Y
Temperature (degree Fahrenheit) 103
102
101
100
99
98
0 8 a.m. 9 a.m. 10 a.m. 11 a.m. 12 a.m. 1 p.m. 2 p.m. 3 p.m. 4 p.m. X
Time
1. What was the patient’s temperature at 11 a.m.?
(a) 101°F (b) 101.5°F (c) 102°F (d) 100°F
2. When was the patient’s temperature 101° Fahrenheit?
(a) 8 a.m. and 10 a.m. (b) 9 a.m. and 10 a.m. (c) 10 a.m. and 11 a.m. (d) 8 a.m. and 9 a.m.
3. When was the minimum temperature recorded?
(a) 10 a.m. (b) 11 a.m. (c) 1 p.m. (d) 4 p.m.
4. What was the highest temperature recorded?
(a) 99°F (b) 100°F (c) 101.5°F (d) 102.5°F
5. State True or False:
In no consecutive period the temperature of the patient remained static.
324