
Page 300 - Start Up Mathematics_7
P. 300
4. Tell whether the statement is true or false:
(i) The mode is always one of the numbers in a data.
(ii) The mean is one of the numbers in a data.
(iii) The median is always one of the numbers in a data.
(iv) The data 6, 4, 3, 8, 9, 12, 13, 9 has mean 9.
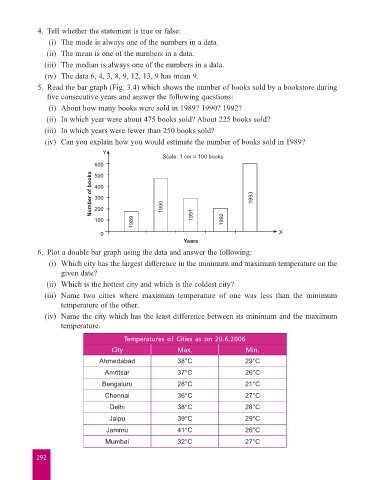
5. Read the bar graph (Fig. 3.4) which shows the number of books sold by a bookstore during
five consecutive years and answer the following questions:
(i) About how many books were sold in 1989? 1990? 1992?
(ii) In which year were about 475 books sold? About 225 books sold?
(iii) In which years were fewer than 250 books sold?
(iv) Can you explain how you would estimate the number of books sold in 1989?
Y
Scale: 1 cm = 100 books
600
Number of books 400 1993
500
300
200
100 1989 1990 1991 1992
0 X
Years
6. Plot a double bar graph using the data and answer the following:
(i) Which city has the largest difference in the minimum and maximum temperature on the
given date?
(ii) Which is the hottest city and which is the coldest city?
(iii) Name two cities where maximum temperature of one was less than the minimum
temperature of the other.
(iv) Name the city which has the least difference between its minimum and the maximum
temperature.
Temperatures of Cities as on 20.6.2006
City Max. Min.
Ahmedabad 38°C 29°C
Amritsar 37°C 26°C
Bengaluru 28°C 21°C
Chennai 36°C 27°C
Delhi 38°C 28°C
Jaipu 39°C 29°C
Jammu 41°C 26°C
Mumbai 32°C 27°C
292