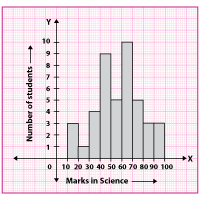
Observe the given histogram. How many students scored marks between 40 and 50?
9 students
10 students
8 students
6 students
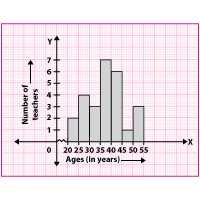
Observe the given histogram. How many teachers are in the youngest age group?
2 teachers
3 teachers
1 teacher
4 teachers
Observe the given histogram. What is the width of each class interval?
5
4
6
7
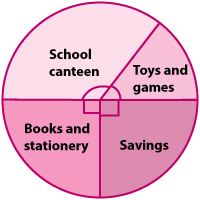
The given pie chart shows how Arushi spent her pocket money last week. If her pocket money was ₹ 360, what is the ratio of her expenditure to the savings?
3 : 1
1 : 3
4 : 3
3 : 4
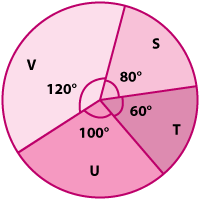
The given pie chart shows the market share of four companies S, T, U and V. If the total market is worth ₹ 72 crores, what is the share of company U?
₹ 20 crores
₹ 22 crores
₹ 18 crores
₹ 24 crores
Observe the given pie chart. If the total marks scored are 540, in which subject 105 marks are scored?