Any point on the X-axis has its x-coordinate zero.
True
False
The point (–2, 4) lies in the second quadrant.
True
False
The two axes divide the coordinate plane into four quadrants.
True
False
While constructing a histogram, the scale on the X-axis and Y-axis should be the same.
True
False
y-coordinate of any point lying on the X-axis is zero.
True
False
Every point on the X-axis has its y-coordinate zero.
True
False
y-coordinate is the distance of the point from X-axis.
True
False
A pie chart is also called a circle graph.
True
False
Click the correct answer.
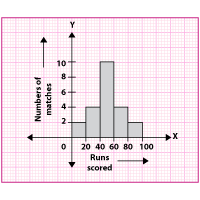
Observe the given histogram. In the highest run group, how much matches were played?
4 matches
6 matches
10 matches
8 matches
Observe the given histogram. How many matches were played in all?
20 matches
24 matches
22 matches
26 matches
Observe the given histogram. In how many matches the score was less than 60 runs?
8 matches
2 matches
16 matches
18 matches
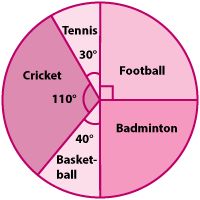
Observe the given pie chart. Which game is played by the least number of students?
Tennis
Basketball
Football
Badminton
Observe the given pie chart. If there are 108 students, how many of them play badminton?
25 students
26 students
23 students
27 students
Maya's monthly salary is ₹ 15,000. The central angle of the sector representing her expenses on a pie chart is 60°. What is the amount that she spends?
₹ 5,000
₹ 2,500
₹ 6,000
₹ 9000
What are the coordinates of a point at a distance of 3 units from X-axis and 6 units from Y-axis?
(0, 3)
(6, 0)
(3, 6)
(6, 3)
Click the correct answer.
The point where the two axes intersect is called the
.
origin
ordinate
point of axes
Any point on
has its x-coordinate zero.
Y-axis
X-axis
both the axes
A
is a graphical representation of a frequency distribution of a grouped data.
histogram
pie chart
line graph
A pictorial representation of numerical data in a circle divided into sectors is called
.
pie chart
histogram
line graph
The point (–6, 0) lies on
.
X-axis
Y-axis
none of the axes
The process of obtaining various information related to the given data from a given pie chart is known as
pie chart.
reading
telling
making
The coordinate axes divide the cartesian plane into four regions (parts) called
.